George Millward and his colleagues at the NOAA Space Weather Prediction Center (SWPC) use IDL, among other tools, to study, monitor and forecast solar events that impact GPS, power grids and communications networks on Earth. On the WSA-Enlil Solar Wind Prediction page, Dr. Millward uses IDL Object Graphics to visualize output from a model of solar activity and Javascript to animate the result as a time series. Here’s a sample frame from the animation:
(Click to embiggen.)
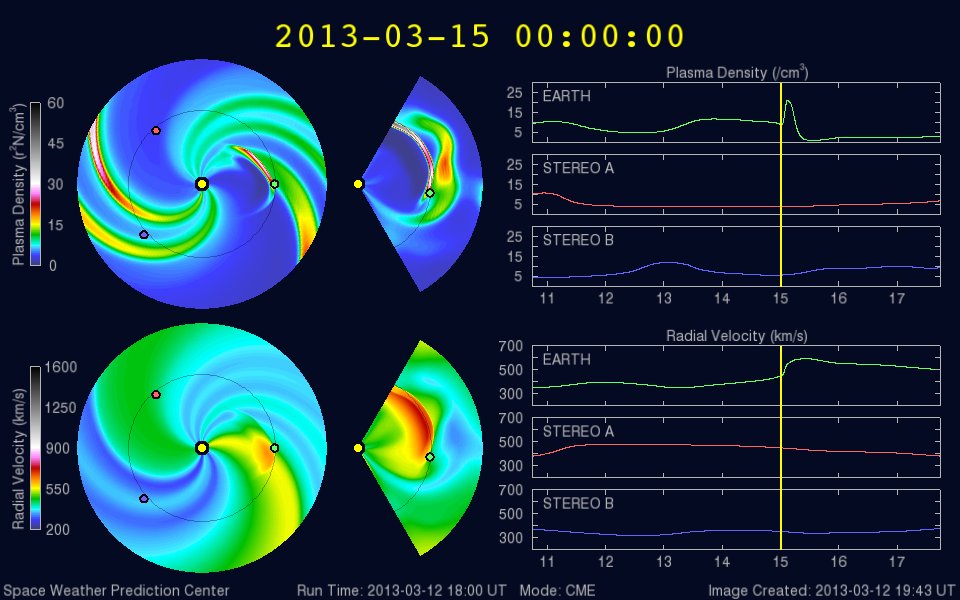
From the WSA-Enlil Solar Wind Prediction page, a description of this plot:
The top row plots show predictions of the solar wind density. The bottom row plots show solar wind velocity. The circular plots on the left are a view from above the North Pole of the Sun and Earth, as if looking down from above. The Sun is the yellow dot in the center and the Earth is the green dot on…
View original post 155 more words
